CW 14 Post NFP charting
On the weekly timeframe, DXY traded above 105.000, seeking buyside liquidity, but ultimately rejected from the weekly order block established on November 6th, 2023.
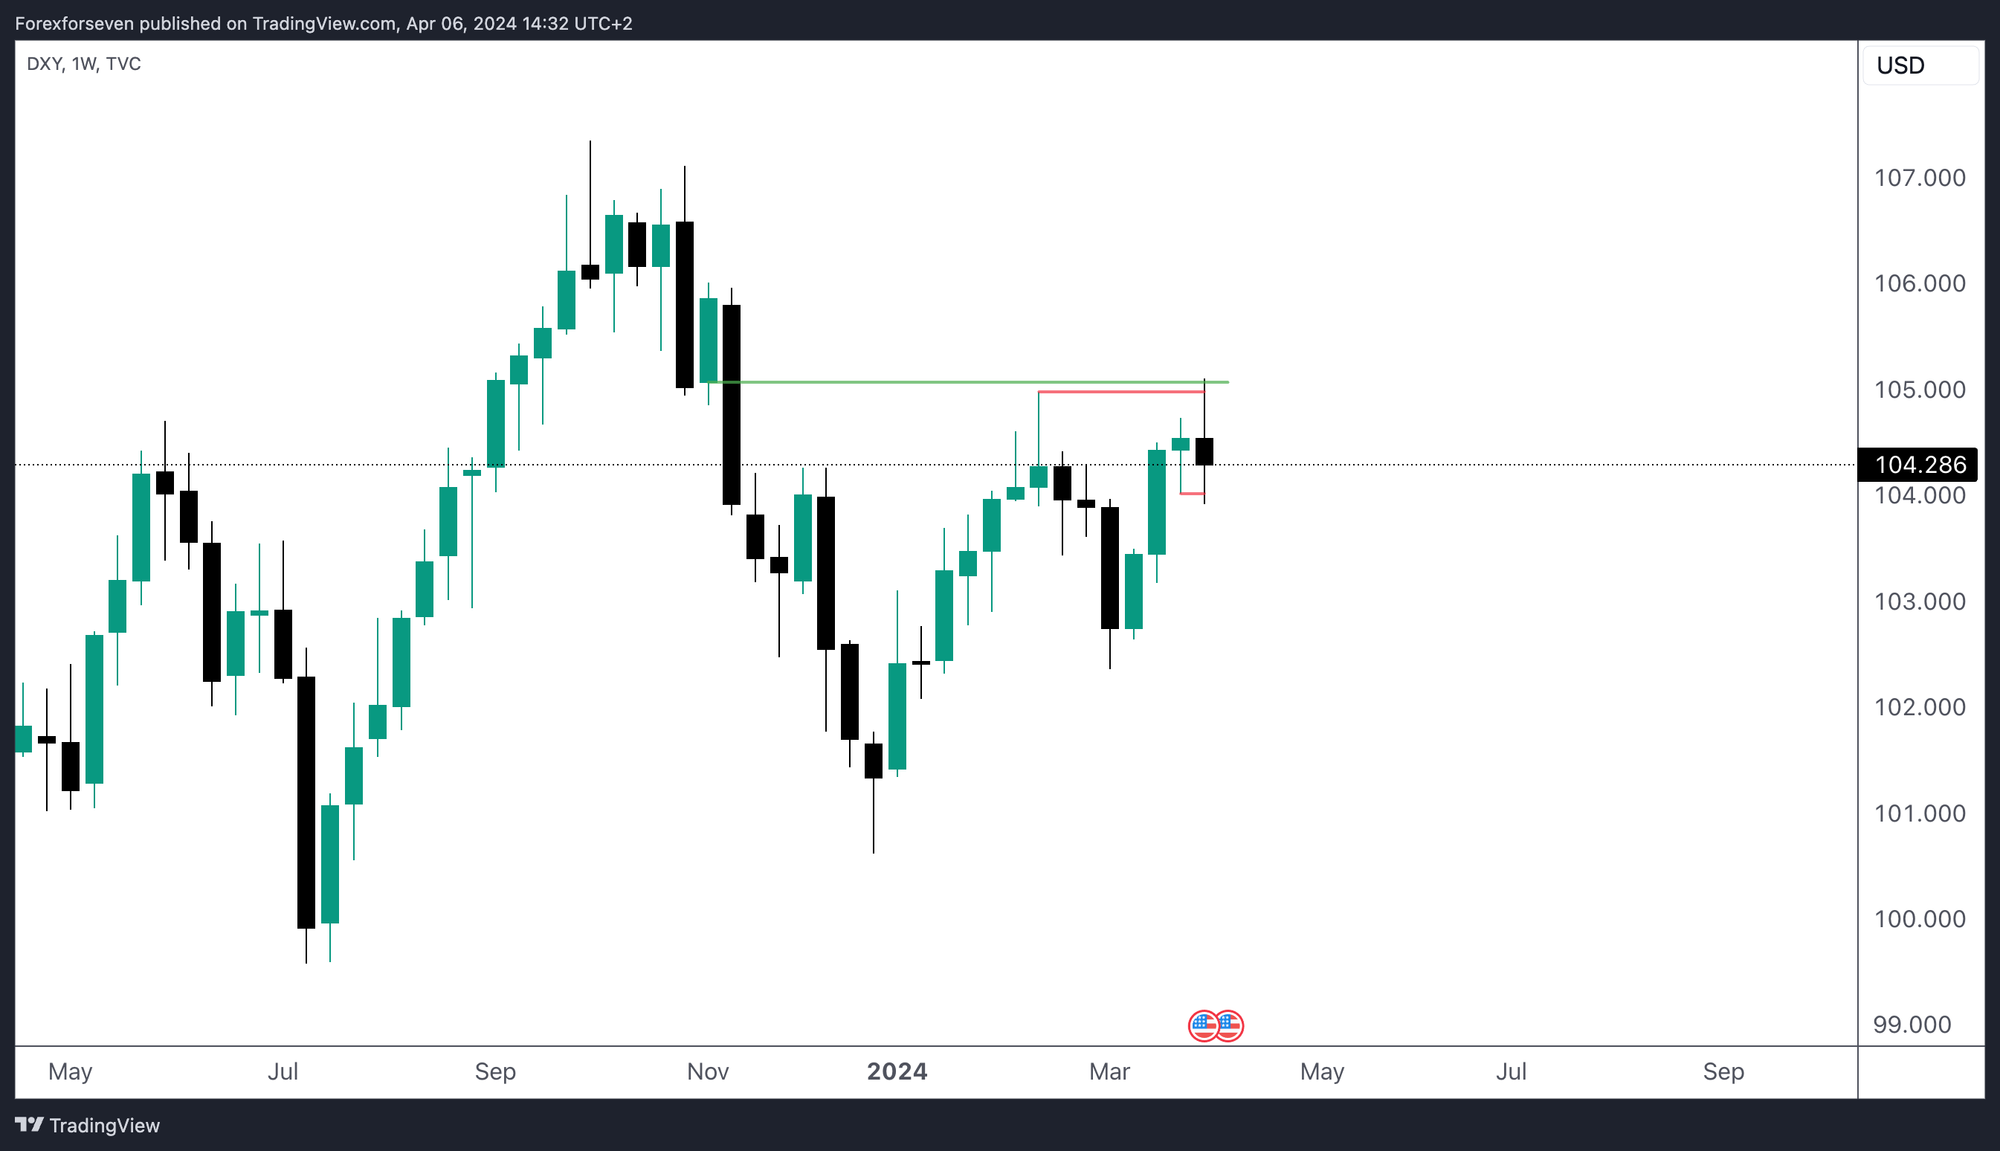
On the weekly timeframe, DXY traded above 105.000, seeking buyside liquidity, but ultimately rejected from the weekly order block established on November 6th, 2023. It attempted to breach the sell side below last week's low, resulting in an outside candle formation for the week.
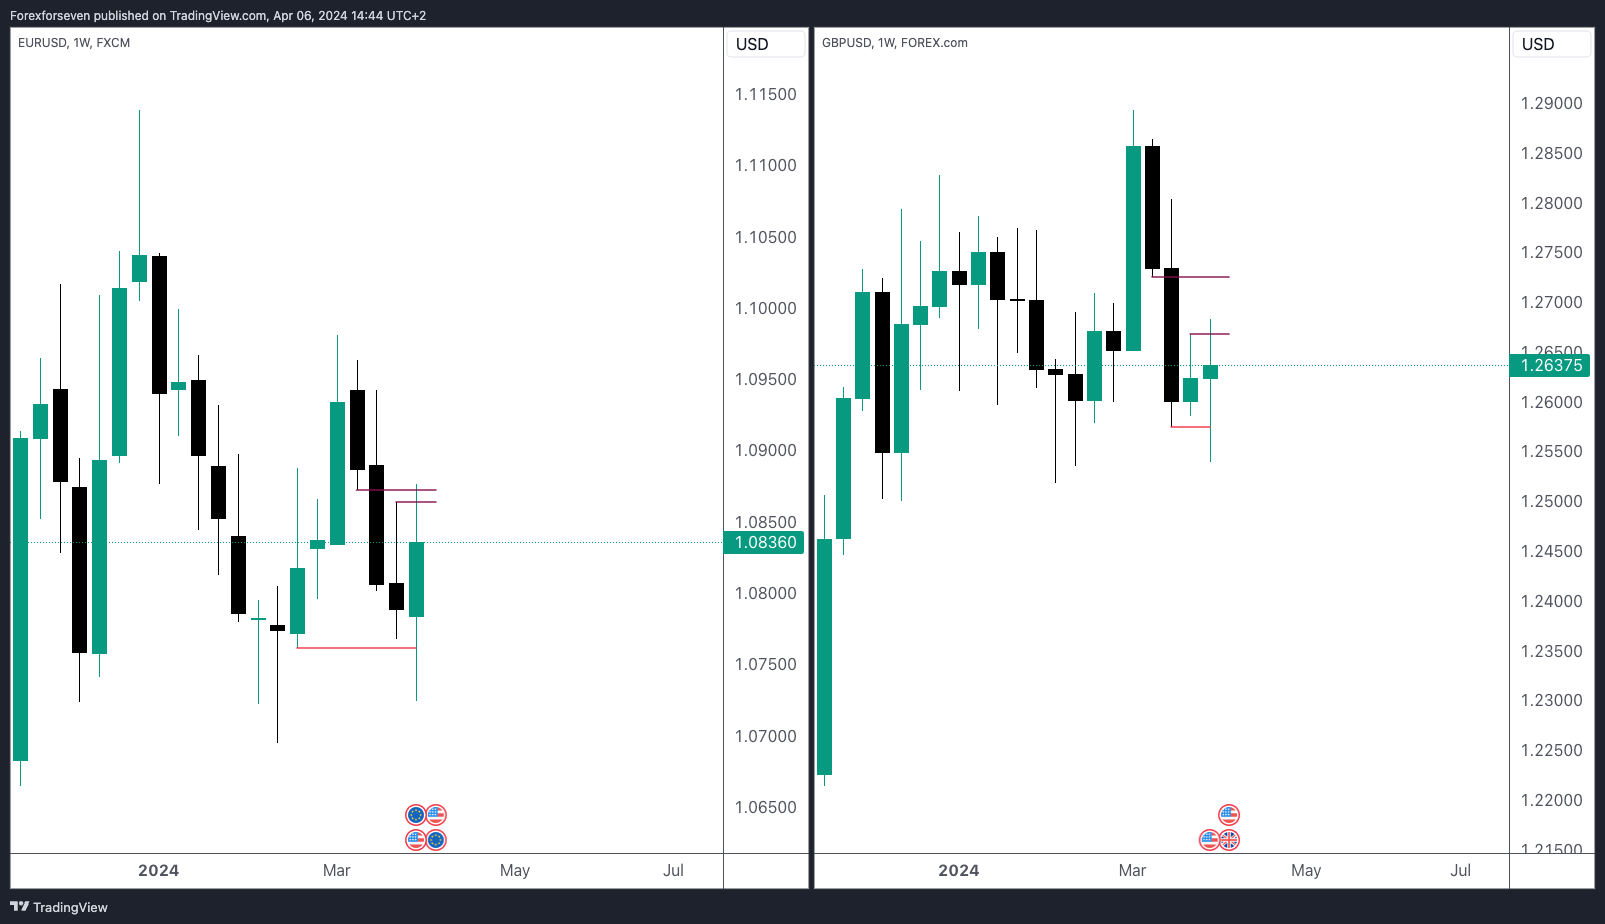
Similarly, we observe the opposite scenario in EUR and GBP. They were in pursuit of sell-side liquidity while breaking above last week's high on the buy side
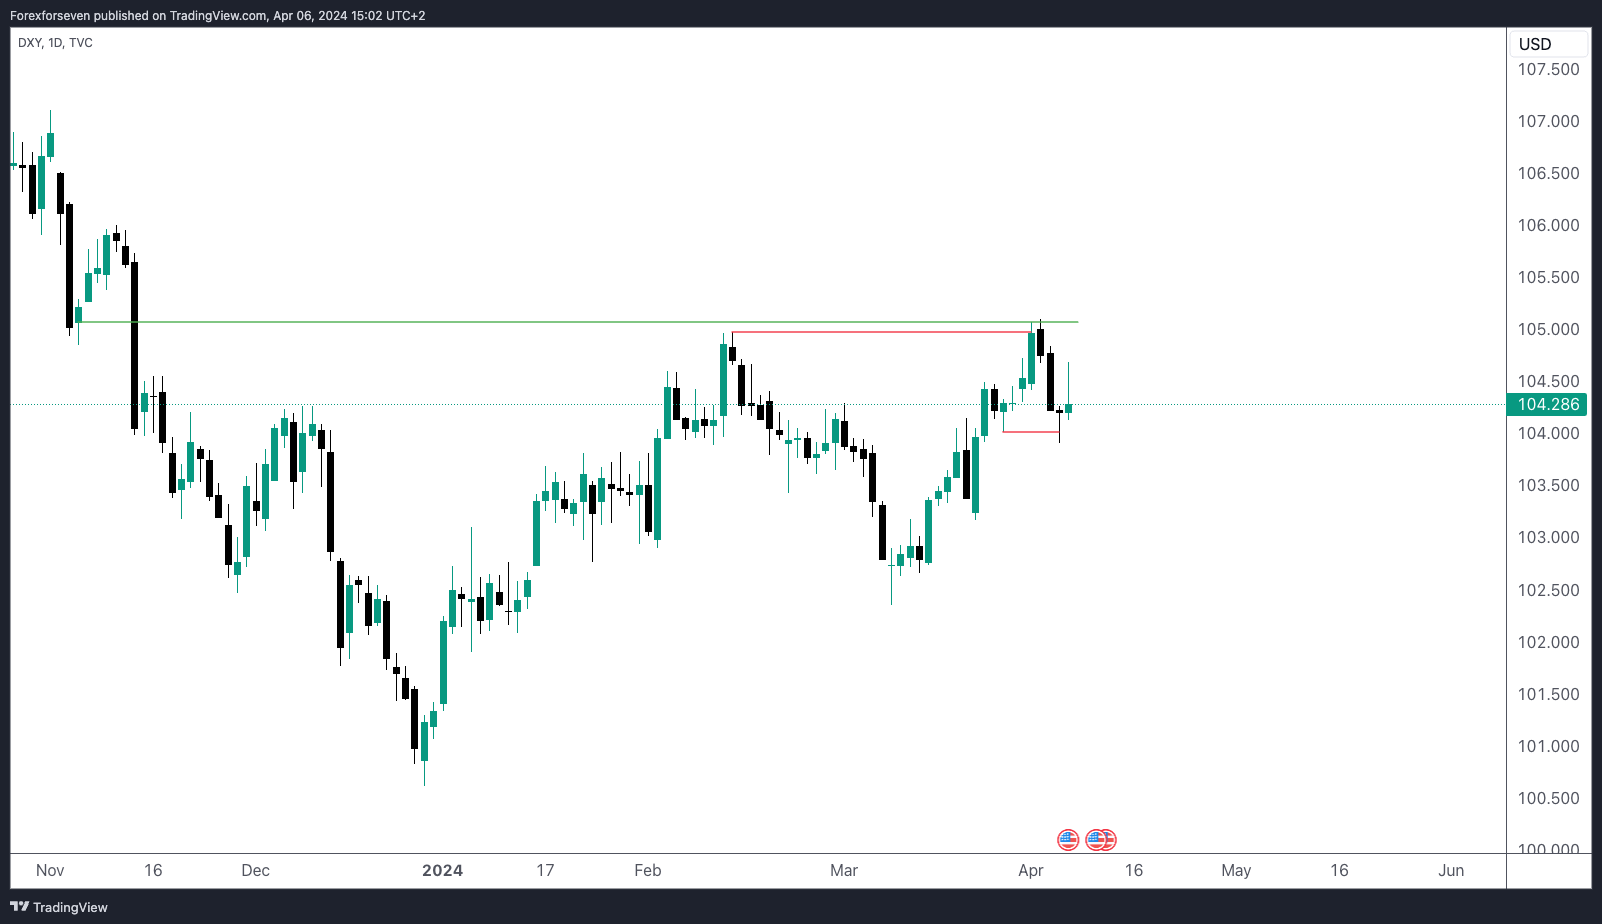
Looking at the daily timeframe and keeping the same levels on the chart, we can see that the weekly high on DXY was formed on Tuesday RED FOLDER NEWS "JOLTS Job Openings." This is noteworthy because Monday already saw a large range day, tapping into buy-side liquidity. Those expecting DXY to rise on Tuesday were trapped. We also notice more movement on Wednesday, followed by breaching the short-term sell side on Thursday before NFP.
EUR behaved similarly, while GBP failed to break below Monday's low.
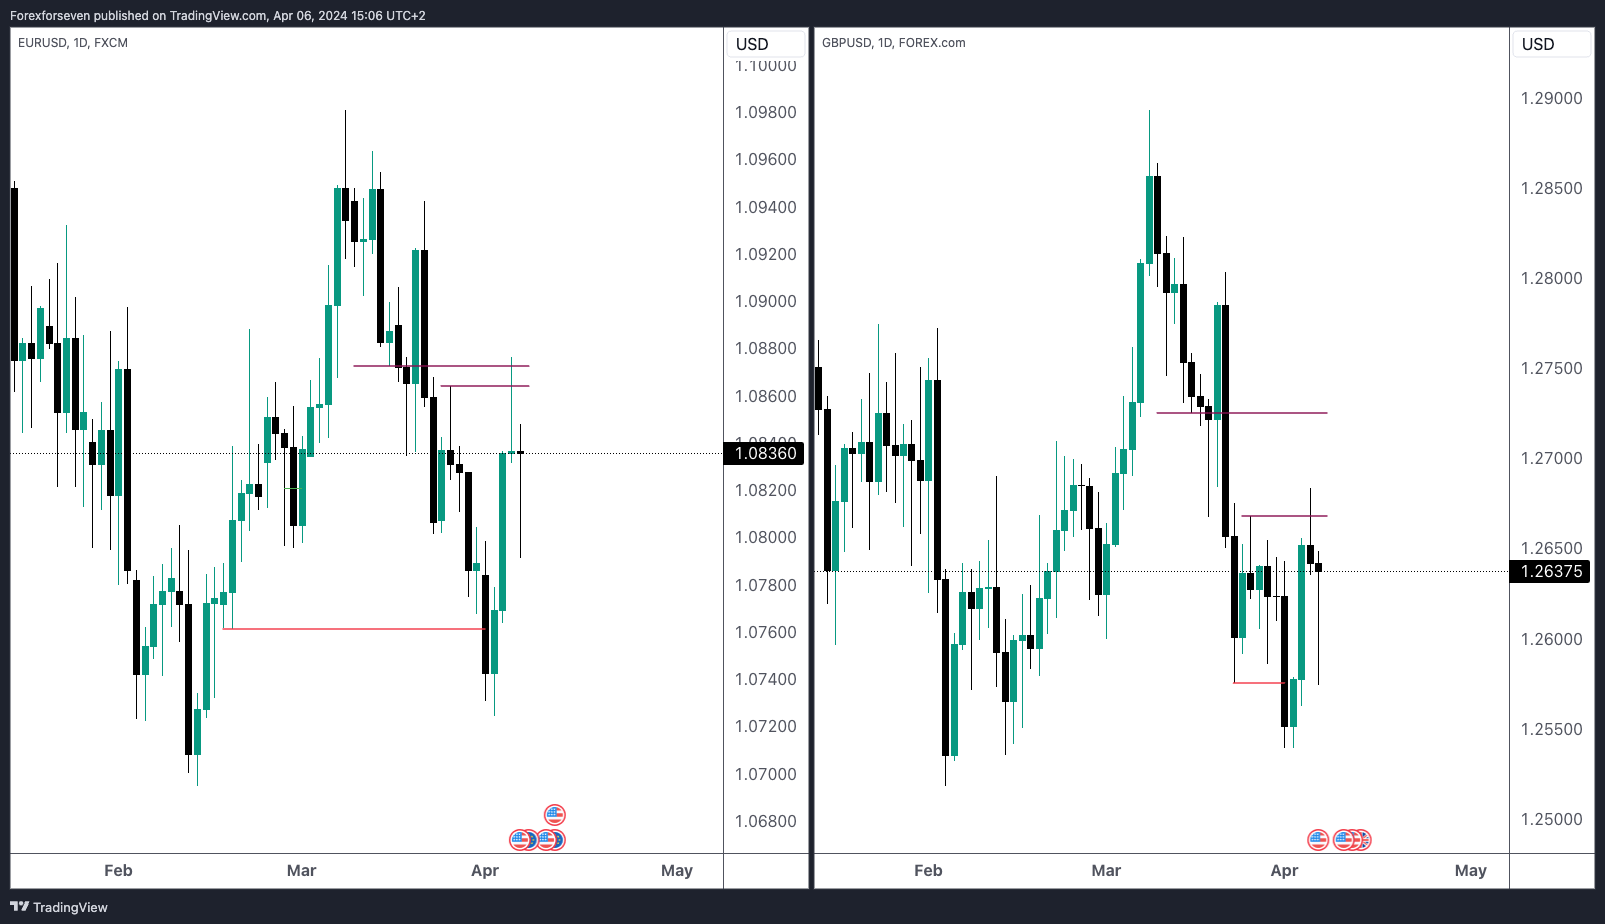
It's noteworthy how EUR adhered to the midpoint of the daily order block.
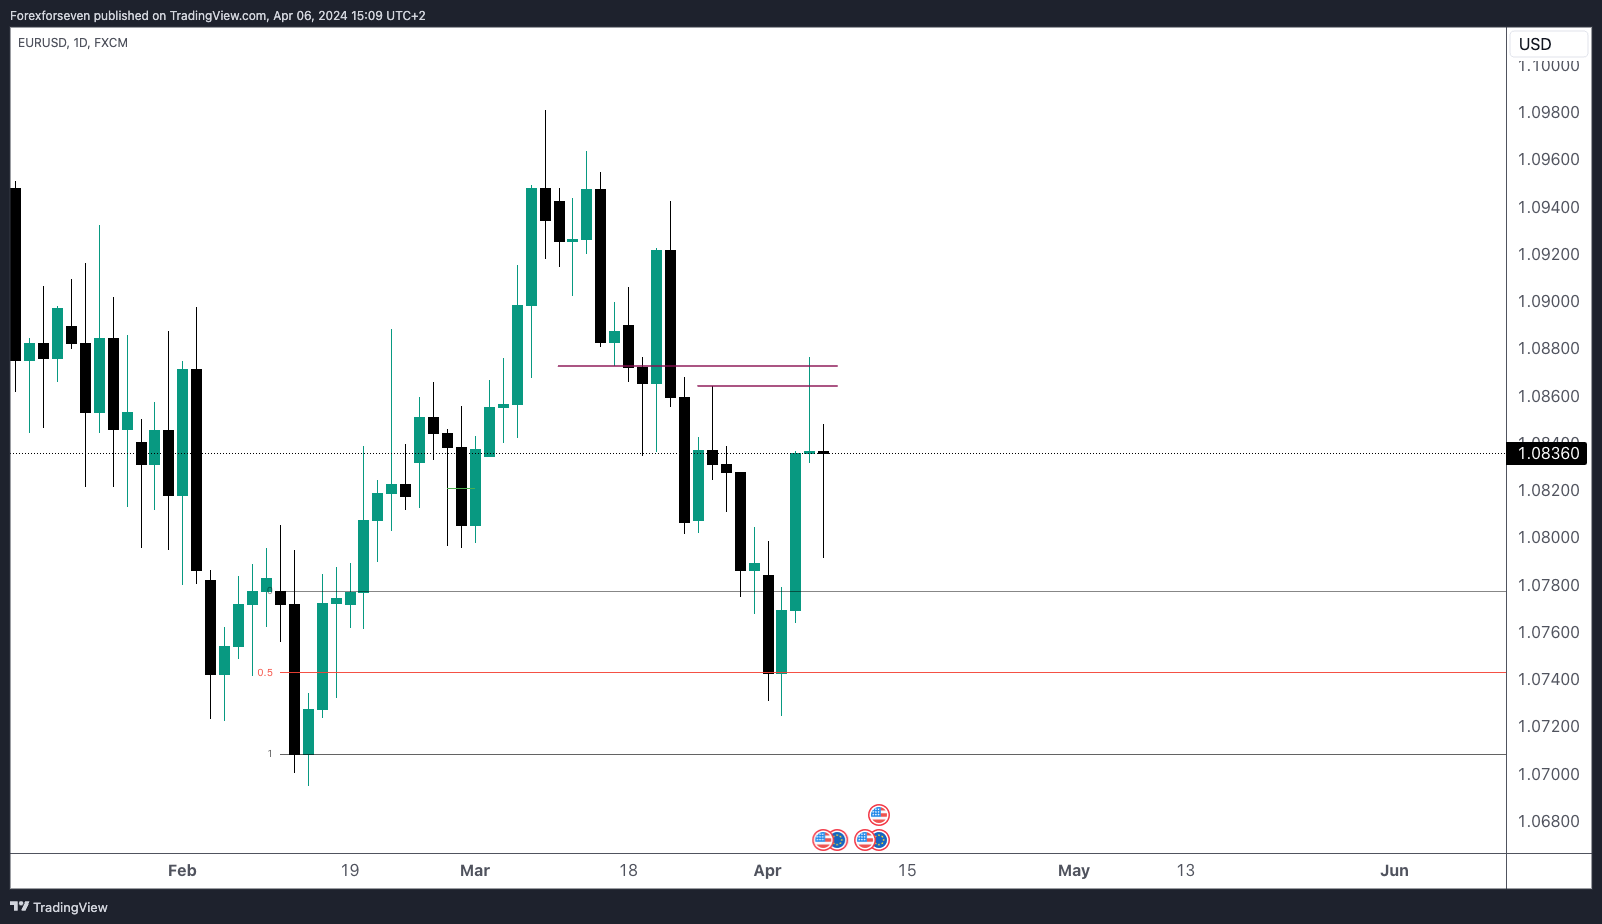
On the 4-hour timeframe, Thursday's price rejection in New York followed by continuation on friday aligns with the weekly levels, serving to rebalance the displacement observed on Wednesday.
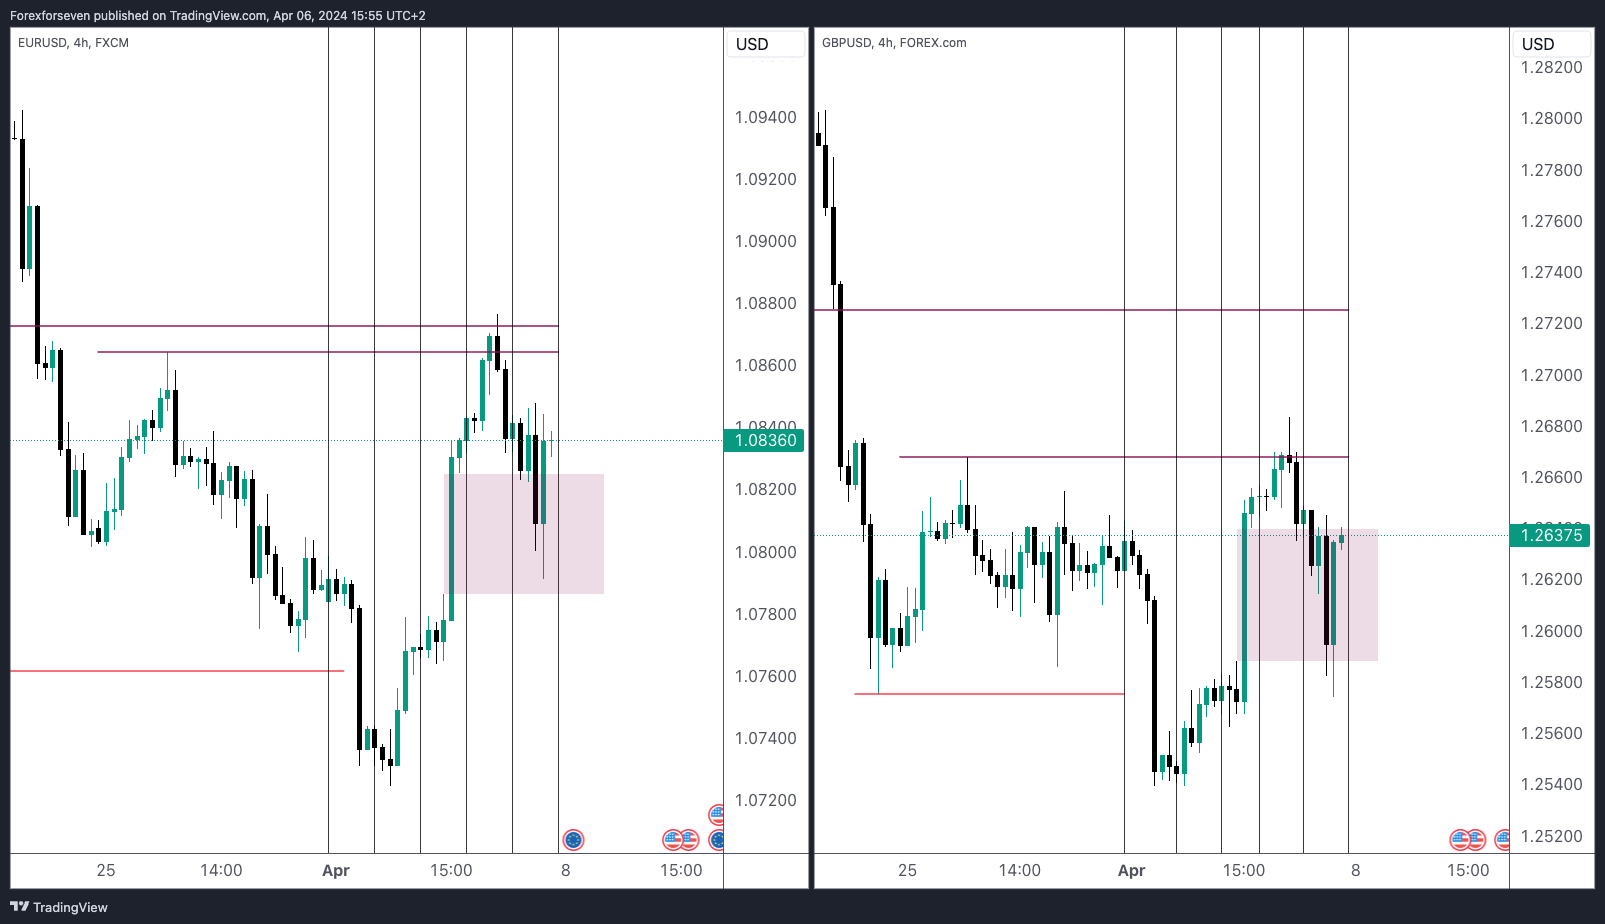
Note the AMD (Accumulation, Manipulation, Distribution) pattern on GBPUSD. Last week's price action marked the accumulation phase, while Monday represented the manipulation phase, followed by distribution.
1 Hour chart GBPUSD
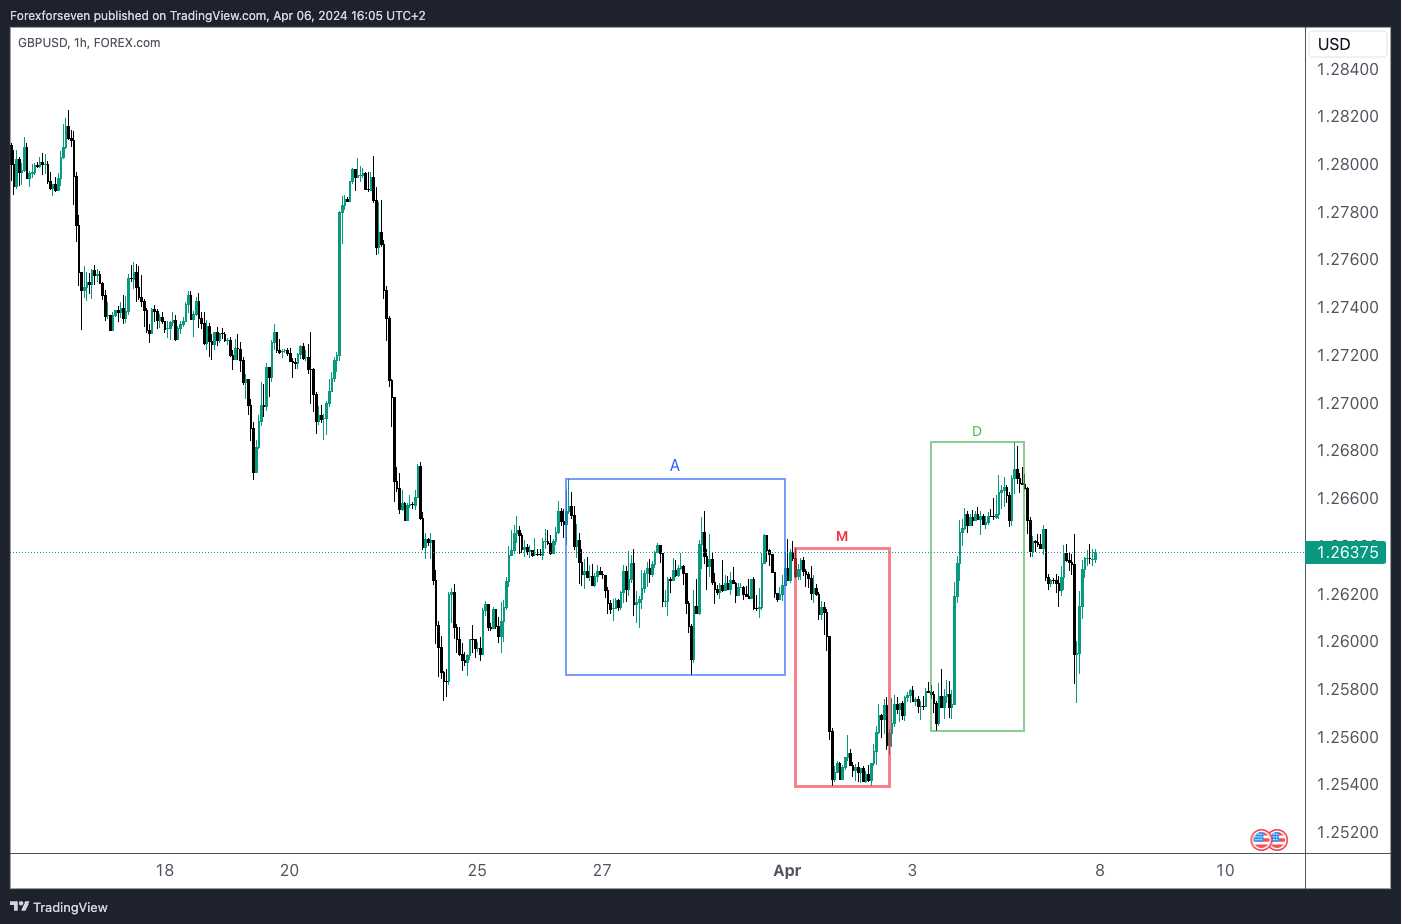
Analyzing the market after it has closed provides valuable insights into how price sought liquidity. It helps us grasp market mechanics better and, with practice, enhances our ability to forecast price movements.
Happy trading!

